In California, total water resources fluctuate between 30 and 50 billion m3 per year. They are heavily exploited and sometimes limited for agricultural, urban, industrial, and environmental needs. Water comes from surface water (rivers, lakes) and 30% from groundwater, which is close to overexploitation, particularly in the Central Valley. Availability varies considerably depending on the region and season, with rainfall in the north and drought in the south, which is therefore heavily dependent on imports.
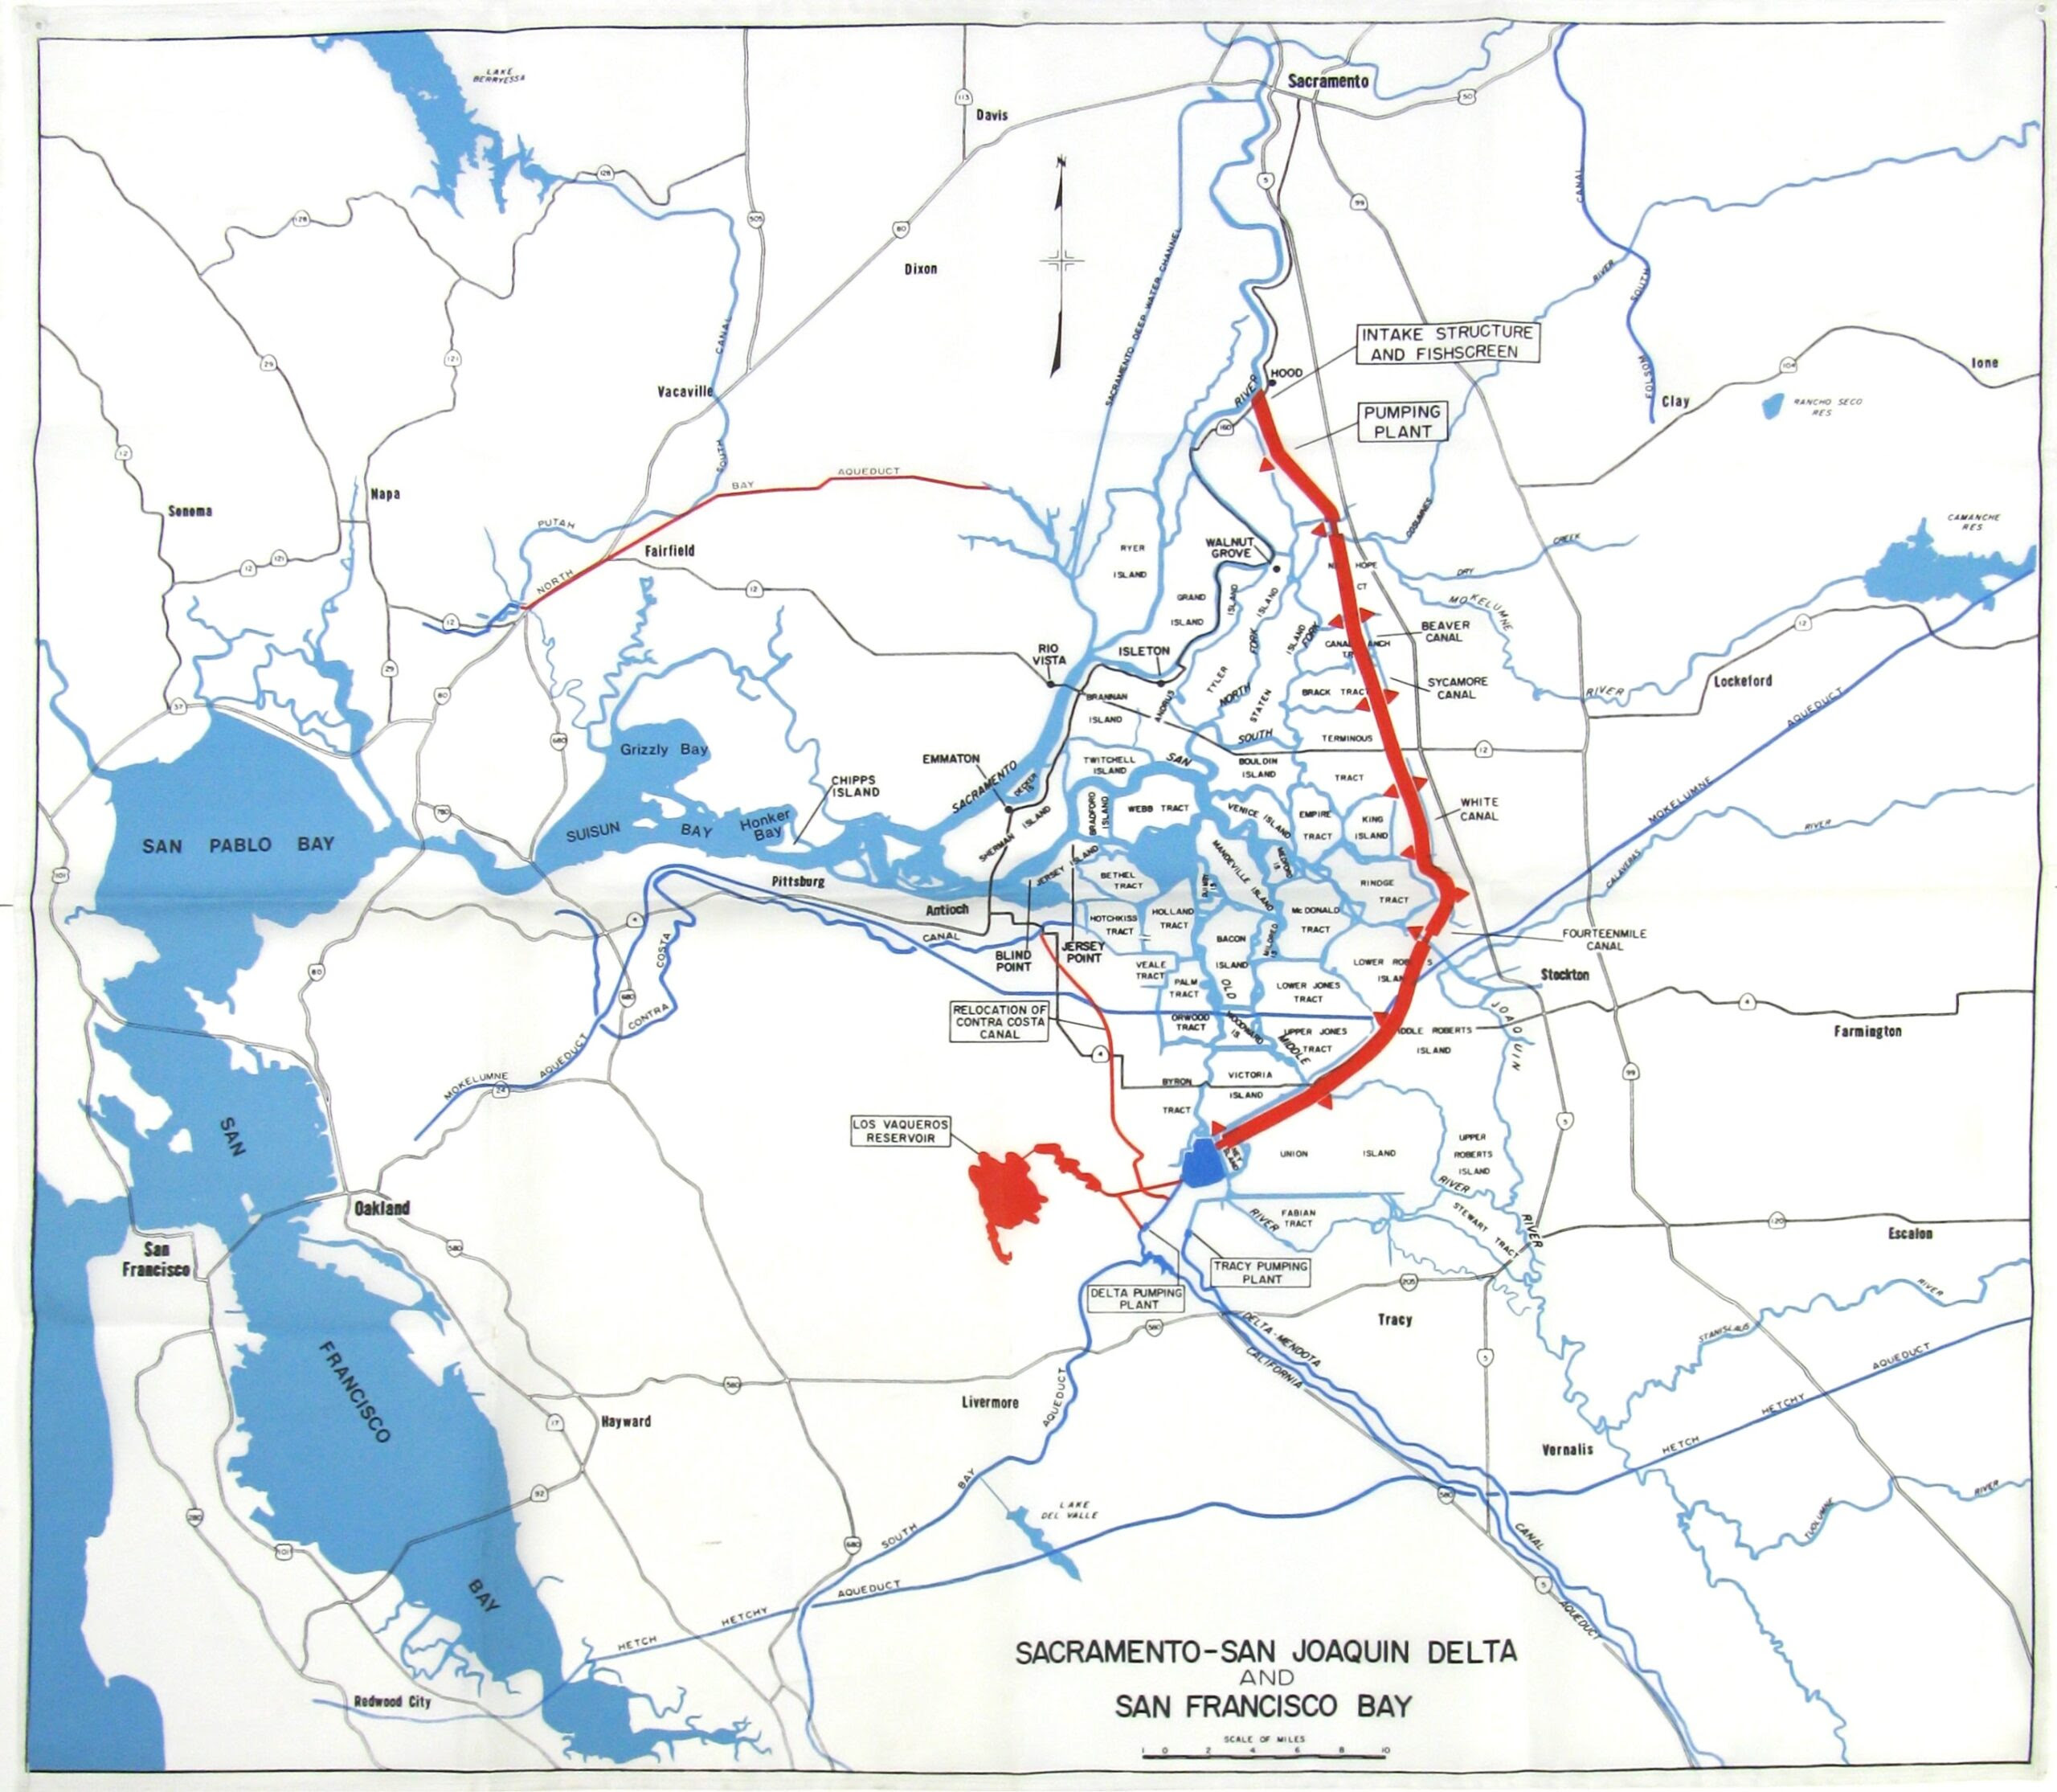
Faced with this recurring shortage, Southern California has developed major infrastructure, including aqueducts (California State Water Project and Central Valley Project) to transfer water from one region to another, as well as dams, canals, and wells to meet growing demand. Desalination and water reuse are also being developed, but are more costly and controversial. Climate change is exacerbating the situation by altering rainfall patterns, reducing snowpack in the Sierra Nevada, and increasing the frequency and intensity of both droughts and floods. Accelerated glacier melt and sea level rise, possibly by 30 cm by 2050, threaten to salinize the Sacramento-San Joaquin Delta, the heart of the state's water supply system. All this in a region with high seismic activity, which could damage the levees and suddenly let in salt water from the Pacific, affecting half of the state's 40 million inhabitants.
In anticipation of this, the California Department of Water Resources (DWR) and its State Water Project (SWP) are planning a colossal new $20 billion project called the Delta Conveyance Project (DCP). This involves a tunnel approximately 10 meters in diameter and 72 km long, drilled to a depth of around 30 meters in the soft silt beneath the delta, between the state capital of Sacramento and the city of San Francisco. The “Delta” is the confluence of the San Joaquin and Sacramento rivers, with the latter receiving two new water intakes as part of the project.
Considering that this DCP will serve 30 million people (approximately 70% of California's population), this is a huge challenge for the most populous state in the United States.
Lien : A Century of Delta Conveyance Plans – California Water Library
Drinking water and green spaces
In California, pumping and treating drinking water consumes 3% of the state's electrical energy, or 7,500 GWh per year. The energy required per m3 of water consumed is approximately 1 KWh. In addition, the California Department of Water Resources estimates that 30% of urban water is used for watering gardens, or approximately 2.8 billion m3. Parks consume an additional 9%, or 0.9 billion m3 or 235 billion gallons. The total amount of water used to irrigate parks and gardens is equivalent to domestic drinking water consumption.
With the aim of increasing energy efficiency, a program was launched in 2012 by the California Energy Commission (CEC), which worked on irrigation controllers in order to standardize this equipment for green spaces. A 2023 progress report provides some interesting data. The 960 standardized controller models would save 15% of water, mainly in parks, or approximately 200 million m3 of water and 200 GWh of electricity per year, with an estimated savings of $275 million for the state. A controller would save an average of 50 m³ of water annually, $900 over its lifetime, with a return on investment in a few months.
Among other things, a WaterSense program is looking at “smarter” controllers with soil moisture or weather sensor inputs.
Irrigation controllers for green spaces automate the planning of the day and time of irrigation, as well as the duration, with conventional solenoid valves opening to a network of sprinklers, diffusers, and/or drippers.
Without a controller, the owner opens and closes the irrigation valve manually to water their green spaces. Owners and occupants of residential and commercial properties maintain their landscaped areas using several irrigation methods, namely manual watering, which is still practiced today, integrated watering systems, and drip irrigation. Controllers regulate three-quarters of green spaces, so proper programming is essential to maintaining this lifestyle of immaculate lawns and blue skies.
Over-irrigation and water efficiency
Over-irrigation of green spaces is common in California, as elsewhere. Excess water is typically lost through percolation, runoff, and evaporation. A 2009 study by the Metropolitan Water District estimated that water use was 150% of what was necessary. Another survey of individual garden owners conducted by the Southern California Metropolitan Water District showed that about half of them water three to four days a week, far exceeding the amount needed to keep plants healthy. Another study of homeowners conducted by the Irvine Ranch Water District found that more than half of irrigation controllers are set to irrigate every day or every other day. In addition, residents are unaware of the water needs of their lawns, shrubs, and trees.
Effectiveness of irrigation planning Efficiency of irrigation planning
Irrigation of green spaces must adapt to variable demand and supplement rainfall. Irrigation requirements in the landscaping sector vary due to many factors, including vegetation type, soil type, geographic location, shade, time of year, and recent weather events.
Figure 2-4 illustrates how irrigation requirements in the landscaping sector vary depending on location and time of year.
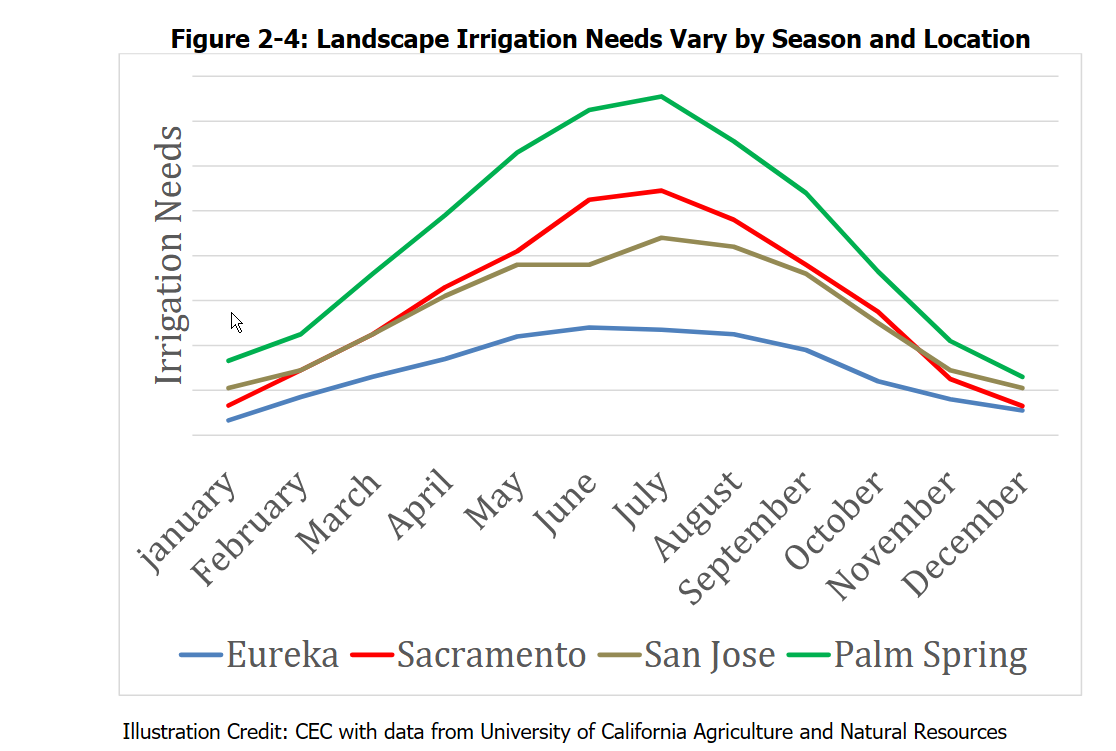
In winter, when California's climate is cool and precipitation is more frequent, irrigation needs are low. In summer, when the weather is hot and precipitation is scarce, irrigation is necessary. Irrigation controllers allow for tailored irrigation schedules to meet this demand.
Figure 2-5 provides an example of water savings achieved with an irrigation controller that can schedule irrigation based on the needs of the landscape compared to typical owner scheduling, as found in a study by the Irvine Ranch Water Distri
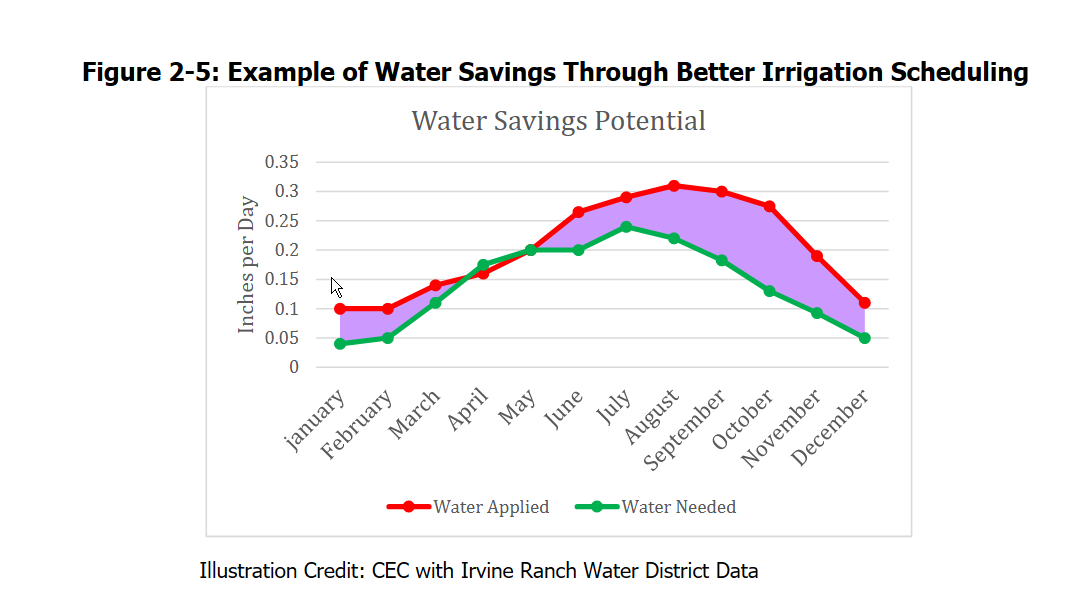
The lower line corresponds to the irrigation required to keep plants healthy, while the upper line corresponds to the average irrigation applied by the owners observed in the study. The shaded area between the two lines represents the potential savings from irrigation management that could modify irrigation schedules.
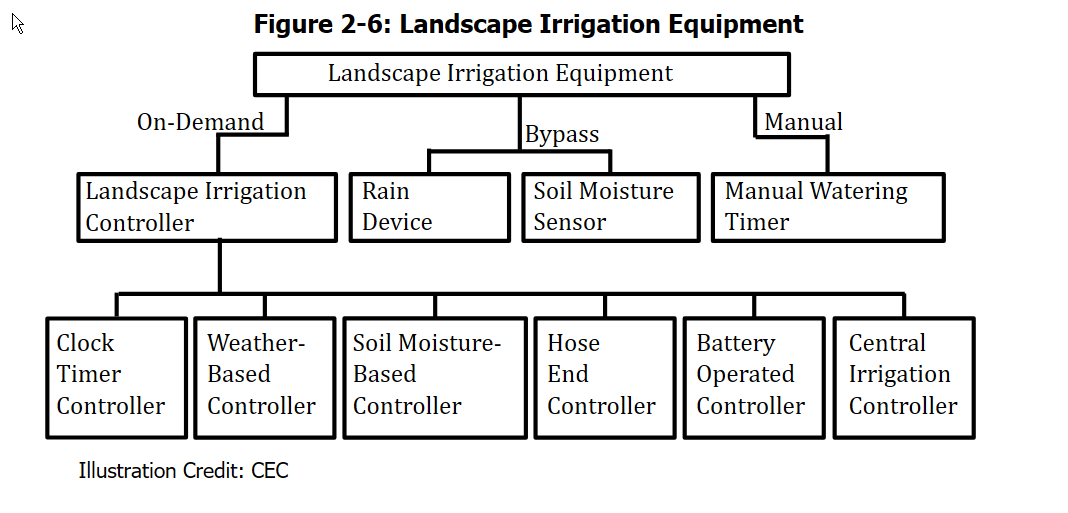
Figure 2-6 summarizes the variety of irrigation controllers available for green spaces:
Ultimately, this overall analysis made it possible to refine the specifications for controllers that can be connected to soil moisture sensors in order to better meet requirements:
• Backup of various irrigation parameters and sensor data in the event of a power failure.
• Option of independent programming by zone, or storage of at least three different programs to allow independent schedules for zones with different requirements.
• Signaling a sensor input fault.
• Possibility of prohibiting certain time slots, for example to comply with hourly or daily restrictions such as Monday-Wednesday-Friday or Tuesday-Thursday-Saturday, or every other day on any day.
• Planning for even or odd days, or any interval between 2 and 7 days.
• The ability to prohibit time slots (for example, between 9:00 a.m. and 9:00 p.m.).
• Shutdown in case of restriction or prohibition.
• Include a percentage adjustment or water budget function, defined as a means of increasing or decreasing the time or dose for zones, by means of an adjustment without changing the stored parameters.
• Be able to revert to a percentage adjustment (water budget) function if the sensor signal is lost.
• Be able to switch to manual mode and automatically return to soil moisture sensor mode.
Conclusion: we can see how strategic thinking about energy and drinking water savings in green spaces has led to a boost in the controller industry.
By Xavier Eftimakis, Agro-engineer
To be continued...